CityData
Overview
CITYDATA™ provides Mobility Intelligence™ for smarter cities and real-world businesses. Our platform simulates the presence, activity, and movement of people to build digital replicas for smarter cities and real-world businesses. Our geospatial AI provides fresh, accurate, anonymized, and actionable insights about how people interact with the real world.
Our data APIs and visualization apps reveal the influence and impact of the physical environment on the behaviors, actions, choices, and preferences of the population.
People Intelligence™
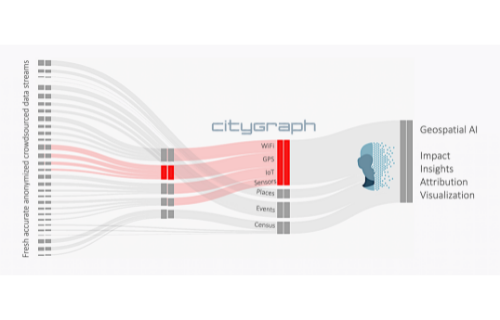
STREAMING CROWDSOURCED GEOSPATIAL AI
CITYDATA is powered by the CITYGRAPH™ technology platform which integrates with thousands of fresh, accurate, anonymized, crowdsourced data sources. Our geospatial AI curates and correlates trillions of data points with physical data like geofences, city blocks, commercial zones, downtown districts, venues, parks, neighborhoods, businesses, and brands. CITYGRAPH also correlates with dynamic data like local events, 311 customer calls, building permits, and demographic surveys to produce actionable and visually stunning data insights in CITYDASH.ai
Smarter Cities
GOVERNMENT AND RESEARCH ORGANIZATIONS
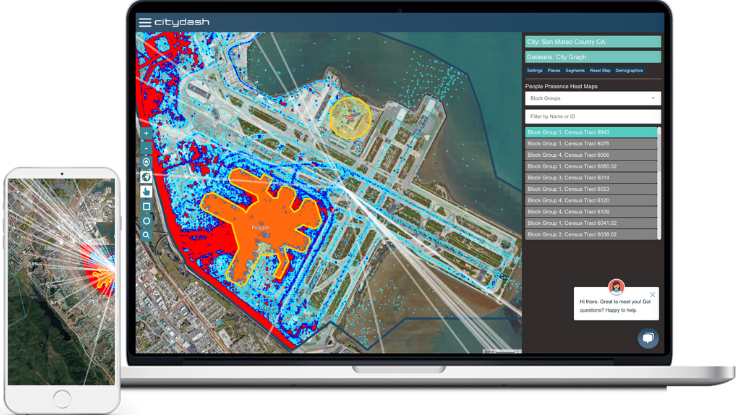
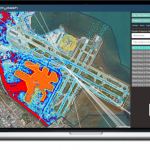
CITYDATA analyzes thousands of cities on a global scale. Our self-serve map-based visual dashboard called CITYDASH.ai combines public and private datasets to unearth insights for civic impact.
Our geospatial data insights are essential for agencies that are focused on economic development, public health, urban planning, mobility, transportation, IoT site selection, smart lighting, parking meters, electric vehicle chargers, public safety, 311 customer service, parks, recreation programs, and city events. CITYDASH™ also provides deep insights for architecture, engineering, construction, and infrastructure management firms as well as for universities, consulting and research organization.
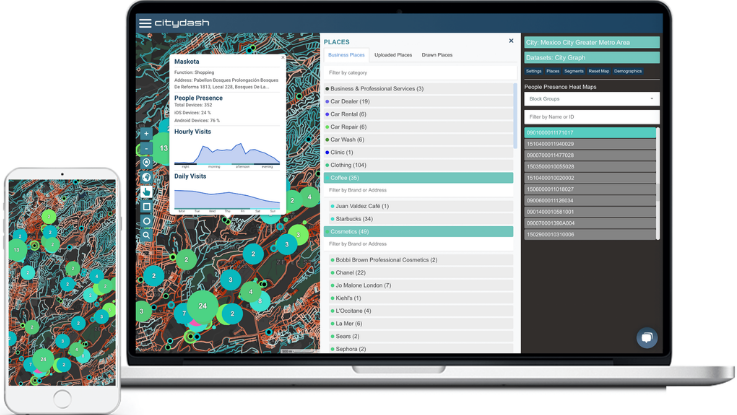
Smarter Businesses
COMMERCIAL, INDUSTRIAL, RETAIL AND PHYSICAL PLACES
CITYDATA provides fresh, accurate, location intelligence and competitive analysis for businesses and brands across many industry verticals.
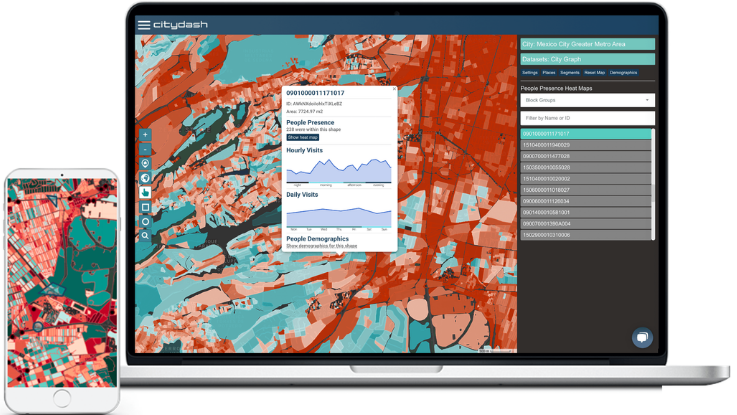
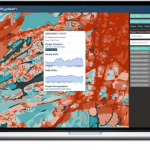
Our self-serve map-based visual dashboard called CITYDASH.ai is updated continuously to publish footfall insights with dwell time, repeat visits, hour-of-day trends, day-of-week trends, affinity cohorts and competitive analysis. Our insights are essential for businesses with a physical presence, retail brands, and OOH operators. The historical data is ideal for investment funds to back-test their thesis and make forward predictions.
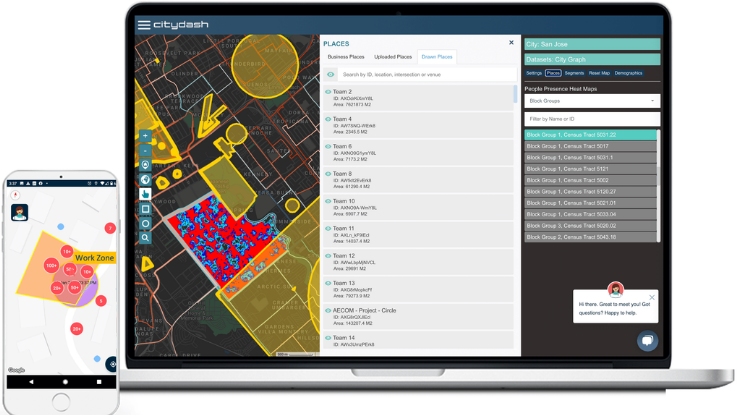
Smarter Resources
REMOTE EMPLOYEES AND FIELD TEAMS
CITYDATA provides the CITYTRACE.ai mobile app and SDK for businesses to stay updated about the presence, activity, and movement of remote employees, sales teams, and field assets in the real world, with explicit consent and opt-in.
The CITYTRACE app helps businesses to define, measure, and understand how their employees interact with places and geofences as they enter customer sites, exit trade areas, venture into restricted zones, or stay within the office. The data insights collected by CityTrace are available to business owners in the form of APIs. CityTrace also pairs perfectly with CITYDASH.ai, our self-serve map-based visual dashboard.
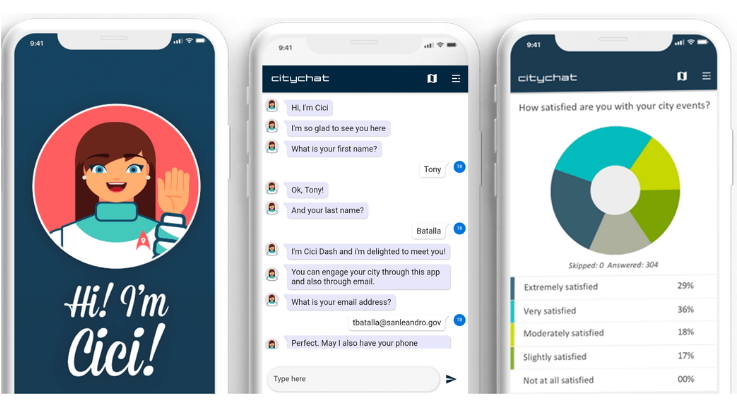
Smarter Chatbots
CITIZEN ENGAGEMENT AND SUPPORT AUTOMATION
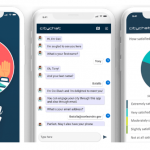
CITYDATA offers the CITYCHAT.ai mobile app and chatbot for engaged citizens and happy cities.
CITYCHAT is powered by Cici, the multi-lingual AI concierge who connects constituents with local government and facilitates continuous interaction. Residents can share with Cici their feedback, opinions, and specific issues like broken streetlights, uneven pavements, unsanitary conditions, noise disturbance, unauthorized parking, or animal control. Cici keeps everyone informed about events and activities organized in their city. Cici also pushes notifications about local crime and emergency alerts.
Smarter Apps
MOBILE DEVELOPERS AND APP PUBLISHERS
CITYDATA provides a light-weight and energy-efficient mobile SDK to mobile app owners, brands and enterprise businesses whose mobile apps are built on the premise of location sharing. The SDK includes the GeoPush services for real-time push notifications with unlimited geofences and movement triggers.
The SDK judiciously collects data signals in real time from mobile apps at relevant moments, with explicit notice and consent, without accessing any personal information. The data patterns, user cohorts and movement insights are returned to the mobile app developers and publishers at no cost.
Details
Issue Impact Analysis
What is the impact of construction noise, potholes, debris, blight on people in the neighborhood? Cities are inundated with 311 reports and complaints every day. CityDash AI helps cities to evaluate the impact of a reported issue by providing a deeper understanding of how many people are in the vicinity of the issue, and might be impacted by a delayed response.
Demographic Analysis
How do income level and unemployment rate correlate with neighborhood blight? Civic complaints like overgrown vegetation, graffiti, blight, illegal postings, abandoned vehicles, shopping carts, garbage, junk, and debris can be correlated with neighborhood demographics in CityDash AI, and addressed through community outreach programs.
Commercial & Industrial Zones
Can cities measure the health of retail businesses and downtown areas? CityDash AI provides macro footfall analysis for commercial and industrial zones, as well as micro analysis for individual establishments, brands and businesses. Cities can combine such data with other indicators to evaluate and track the overall health of the local economy.
Building Occupancy & Usage
Does low occupancy in commercial zones signal an economic downturn? The number of people within buildings and structures can be an excellent indicator of economic health and local employment rate. Cities can utilize CityDash AI to track the aggregate usage trends for office spaces and commercial buildings as well as libraries and community centers.
Community Engagement Analytics
How many people visited farmers’ markets? What is the trend week on week? Cities organize hundreds of events every month, from senior recreation to adult education to youth camps. Cities also host festivals, sporting events, trade shows, and conventions. CityDash AI tracks people counts for events and provide a quantitative measure of community engagement.
Sensor Site Selection Analytics
What are the ideal locations for installing IoT based on people density and movement? Cities are investing hundreds of millions of dollars in deploying IoT grids and smart assets. CityDash AI pinpoints the ideal locations for installing new lighting poles, cameras and sensors based on accurate historical data and heat maps of people presence, activity and movement.
Sensor Grid Impact Analytics
Are the visit trends similar for new connected EV charging stations and legacy chargers? Cities can evaluate the direct impact and benefits of their IoT grid by measuring the tracking people density in proximity of grid assets and sensors, like electric vehicle charging stations, smart displays, outdoor kiosks, solar lighting points, waste receptacles, and transit stations.
Origin-Destination Analytics
Where are people going to, where did they come from, and what places did they visit along the way? Cities are in need of accurate and continuously updated dispersion analysis, also known as origin-destination analysis. CityDash AI provides the tools necessary to understand the flow of people across different neighborhoods, transit hubs, and downtown districts.
Transit Hubs & Routes Analytics
How can shared transportation services operated by the private sector complement public transit?Reducing traffic congestion, lowering emissions, and improving the flow of persons and goods is the #1 priority for cities and metros. CityDash AI provides local government with deep insights about people using public transportation like trains and buses relative to ride-share and scooter-share services.
Disaster Impact Analytics
Did residents in impacted neighborhoods evacuate speedily as wildfires ravaged through California? Public Safety agencies can utilize CityDash.ai to get insights into the effectiveness of established evacuation procedures for natural disasters like earthquakes, floods, hurricanes, tornados as well as accidental disasters like wildfires, explosions, hazardous material incidents.
Billboards & Banners Analytics
How effective were Apple's WWDC banners and billboards in the City of San Jose in the month of June? Cities are monetizing their real estate through real-world marketing promotions for sporting events, conferences, festivals, exhibitions, and concerts. CityDash AI provides an end-to-end platform for campaign management, attribution analytics, and performance measurement.
Parks & Trails Usage Analytics
Are more people visiting local parks, gardens and open spaces this year? CityDash AI empowers cities to make data-driven decisions and allocate budgets and resources for parks and recreation programs based on engagement and usage. The dashboard provides people counts and visit trends by day, month, and season, along with demographic insights.
Blocks, Tracts, Neighborhoods
How can cities evolve beyond people click-counting and error-prone community surveys? Cities need to get smarter with how they count people. CityDash AI provides hourly, daily, and monthly pre-computed people counts based on multi-layered city shapes. The drawing tools enable cities to define custom shapes on the map and measure people counts for each shape.
Crime Incident Impact Analytics
How many people were in the vicinity of the crime incident when it occurred? CityDash AI correlates crime data with people density through the real-world knowledge graph. Police Departments and law enforcement can leverage the graph to inform critical decisions on resource deployment and response time, and can also assist in crime analysis for case investigation.
UCR Analytics & Automation
How can police departments comply with federal data reporting requirements? The FBI requires local law enforcement agencies to submit a comprehensive monthly statistical analysis of city crime data. CityDash.ai saves agencies time and money by automating the UCR compute, presenting through an online dashboard as well as downloadable PDF reports.
Images
Videos

Sorry, you must be logged in to view the rest of this page
Please log in or create an account to view more details.
Log in or Sign UpCustomers and Partners
Sorry, you must be logged in to view the rest of this page
Please log in or create an account to view more details.
Log in or Sign UpDocuments
Sorry, you must be logged in to view the rest of this page
Please log in or create an account to view more details.
Log in or Sign UpExpert Analysis
Sorry, you must be logged in to view the rest of this page
Please log in or create an account to view more details.
Log in or Sign Up


